06 — Baroclinic Structure & Tropopause Pressure
Demonstrates the vertical structure of blocking events using real data:
Composite-mean 3-D PV anomaly at all 9 pressure levels
Longitude–pressure cross-sections at onset / peak / decay
2-PVU dynamical tropopause pressure distribution
[1]:
import numpy as np
import matplotlib.pyplot as plt
import os, glob
from concurrent.futures import ThreadPoolExecutor

from pvtend.plotting import plot_baroclinic_tilt
1 Load composite 3-D fields
[2]:
DATA_ROOT = "/net/flood/data2/users/x_yan/composite_blocking_tempest"

def load_composite_3d(stage, dh, field="pv_anom_3d", max_events=None):
    """Compute composite mean of a 3-D field from all event NPZs."""
    sign = "+" if dh >= 0 else ""
    npz_dir = f"{DATA_ROOT}/{stage}/dh={sign}{dh}"
    files = sorted(glob.glob(os.path.join(npz_dir, "track_*.npz")))
    if max_events:
        files = files[:max_events]

    def _load(f):
        return np.load(f)[field]

    with ThreadPoolExecutor(max_workers=8) as pool:
        arrs = list(pool.map(_load, files))

    return np.nanmean(arrs, axis=0), len(arrs)

# Load for three lifecycle stages at dh=0
stages = ["onset", "peak", "decay"]
composites = {}
for stg in stages:
    composites[stg], n = load_composite_3d(stg, dh=0, field="pv_anom_3d")
    print(f"  {stg:6s}: {n} events, shape {composites[stg].shape}")

# Grid info from one file
d0 = dict(np.load(glob.glob(f"{DATA_ROOT}/onset/dh=+0/track_*.npz")[0]))
lat = d0["lat_vec"]
lon = d0["lon_vec_unwrapped"]
levels = d0["levels"]  # hPa
X_rel = d0["X_rel"]
Y_rel = d0["Y_rel"]
  onset : 1260 events, shape (9, 29, 49)
  peak  : 1260 events, shape (9, 29, 49)
  decay : 1260 events, shape (9, 29, 49)
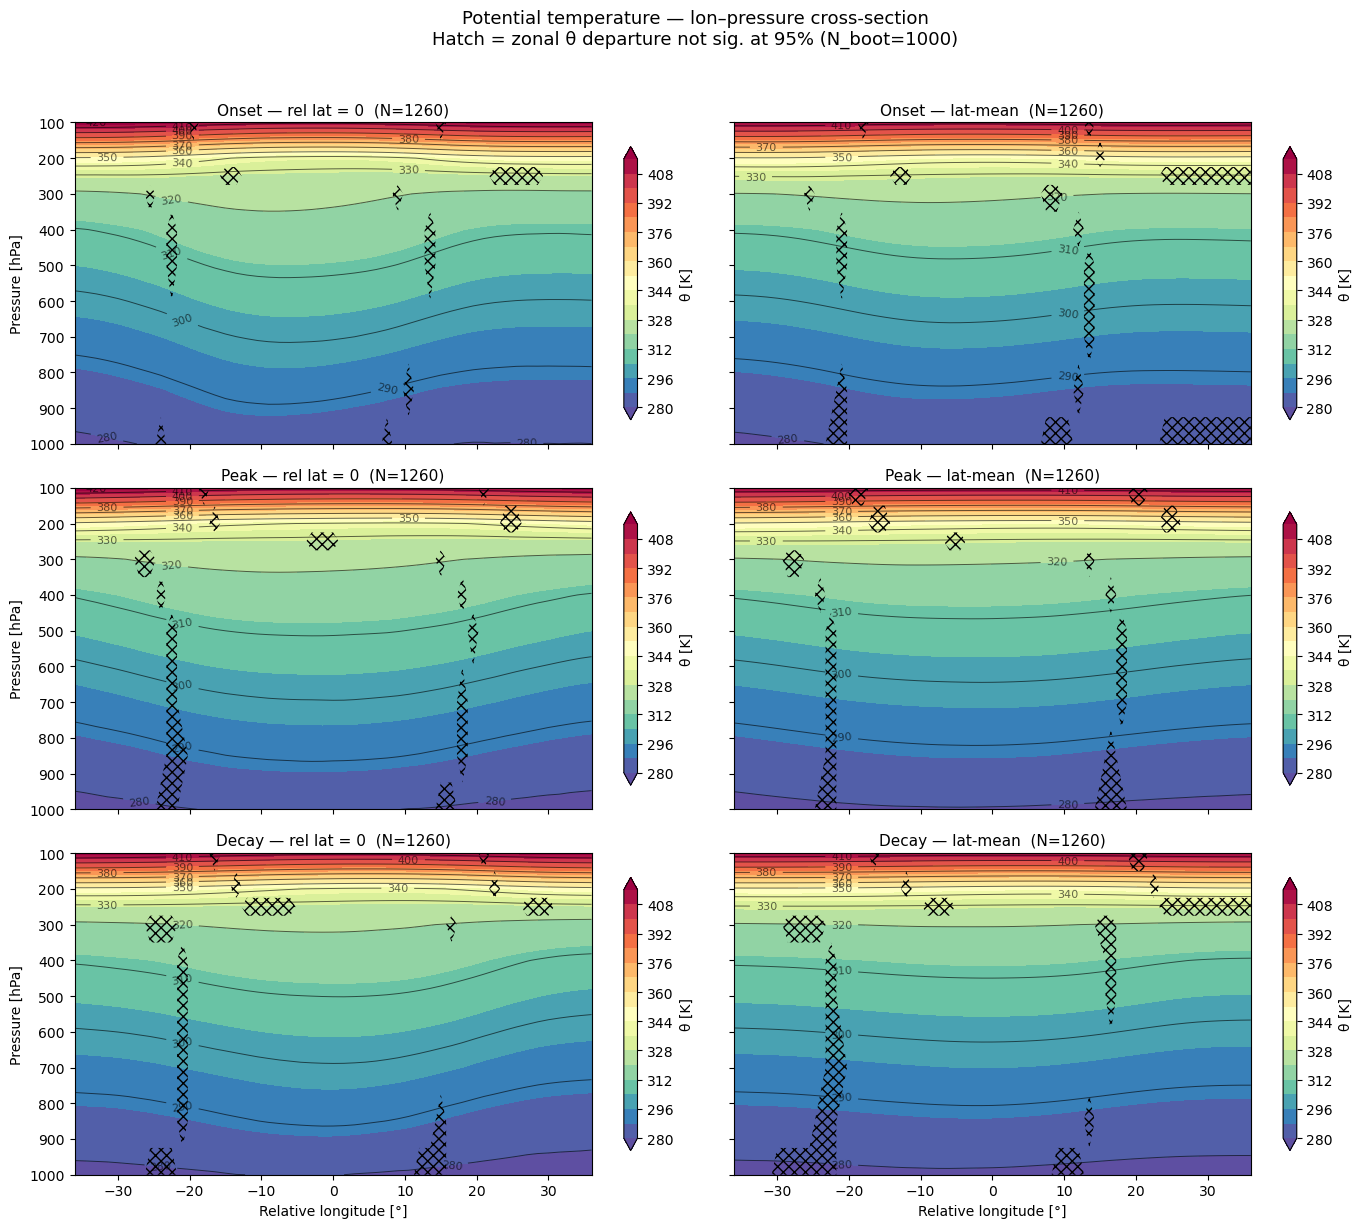
2 θ baroclinic structure — lon–pressure cross-sections (onset / peak / decay)
Absolute potential temperature on the x–p plane reveals the baroclinic tilt of isentropes through the blocking lifecycle. Bootstrap significance tests the zonal departure (θ − zonal-mean θ per event) so hatching marks grid cells where the east–west θ gradient is not significant.
[3]:
# ── Settings ──────────────────────────────────────────────────────────────────
N_BOOT = 1000
ALPHA  = 0.05
SEED   = 42

from zipfile import BadZipFile
from functools import partial

# ── Generic cross-section loader ─────────────────────────────────────────────
def _load_xp(f, field="theta_3d"):
    """Load a 3-D field → (mid_row, lat_mean), each (nlev, nlon)."""
    try:
        d = np.load(f)
    except (BadZipFile, EOFError, OSError):
        return None
    arr = d[field]                             # (nlev, nlat, nlon)
    imid = arr.shape[1] // 2
    return arr[:, imid, :], np.nanmean(arr, axis=1)


def load_xsections(stage, field, dh=0):
    """Per-event cross-sections → (mid, avg), each (N, nlev, nlon)."""
    sign = "+" if dh >= 0 else ""
    npz_dir = f"{DATA_ROOT}/{stage}/dh={sign}{dh}"
    files = sorted(glob.glob(os.path.join(npz_dir, "track_*.npz")))
    loader = partial(_load_xp, field=field)
    with ThreadPoolExecutor(max_workers=8) as pool:
        results = list(pool.map(loader, files))
    results = [r for r in results if r is not None]
    return np.array([r[0] for r in results]), np.array([r[1] for r in results])


def bootstrap_xp(stack, n_boot=N_BOOT, alpha=ALPHA, seed=SEED):
    """Bootstrap mean + sig for (N, ...) array. sig=True where CI excludes 0."""
    N = stack.shape[0]
    rng = np.random.default_rng(seed)
    boot = np.empty((n_boot, *stack.shape[1:]))
    for b in range(n_boot):
        idx = rng.integers(0, N, size=N)
        boot[b] = np.nanmean(stack[idx], axis=0)
    lo = np.nanpercentile(boot, 100 * alpha / 2, axis=0)
    hi = np.nanpercentile(boot, 100 * (1 - alpha / 2), axis=0)
    mean = np.nanmean(stack, axis=0)
    sig = ~((lo <= 0) & (hi >= 0))
    return mean, sig


# ── Load per-event θ & bootstrap ─────────────────────────────────────────────
theta_xp = {}
for stg in stages:
    print(f"Loading θ ({stg}) ...")
    mid, avg = load_xsections(stg, "theta_3d", dh=0)
    N = mid.shape[0]
    # Anomaly = θ − zonal mean θ (per event) → tests baroclinic tilt significance
    mid_anom = mid - np.nanmean(mid, axis=-1, keepdims=True)
    avg_anom = avg - np.nanmean(avg, axis=-1, keepdims=True)
    print(f"  Bootstrapping (N={N}, n_boot={N_BOOT}) ...")
    _, sig_mid = bootstrap_xp(mid_anom)
    _, sig_avg = bootstrap_xp(avg_anom)
    mean_mid = np.nanmean(mid, axis=0)
    mean_avg = np.nanmean(avg, axis=0)
    theta_xp[stg] = dict(mean_mid=mean_mid, sig_mid=sig_mid,
                          mean_avg=mean_avg, sig_avg=sig_avg, n=N)
    print(f"  {stg:6s}: mid {100*sig_mid.mean():.0f}% sig, "
          f"avg {100*sig_avg.mean():.0f}% sig")

# ── Plot: 3 rows (onset/peak/decay) × 2 cols (lat=0 / lat-mean) ─────────────
fig, axes = plt.subplots(3, 2, figsize=(14, 12), sharey=True, sharex=True)
x_vec = X_rel[0]
p_vec = levels.astype(float)

for row, stg in enumerate(stages):
    d = theta_xp[stg]
    for col, (mean_fld, sig_mask, lbl) in enumerate([
        (d["mean_mid"], d["sig_mid"], "rel lat = 0"),
        (d["mean_avg"], d["sig_avg"], "lat-mean"),
    ]):
        ax = axes[row, col]
        cf = ax.contourf(x_vec, p_vec, mean_fld,
                         levels=21, cmap="Spectral_r", extend="both")
        # Isentrope contour lines
        cs = ax.contour(x_vec, p_vec, mean_fld,
                        levels=np.arange(280, 440, 10),
                        colors="k", linewidths=0.7, alpha=0.6)
        ax.clabel(cs, inline=True, fontsize=8, fmt="%.0f")
        # Insignificance hatching (zonal θ departure CI includes 0)
        ax.contourf(x_vec, p_vec, (~sig_mask).astype(float),
                    levels=[0.5, 1.5], hatches=["xxx"], colors="none", zorder=5)

        ax.set_title(f"{stg.capitalize()} — {lbl}  (N={d['n']})", fontsize=11)
        if col == 0:
            ax.set_ylabel("Pressure [hPa]")
        if row == 2:
            ax.set_xlabel("Relative longitude [°]")
        plt.colorbar(cf, ax=ax, shrink=0.85, label="θ [K]")

axes[0, 0].invert_yaxis()
fig.suptitle(
    "Potential temperature — lon–pressure cross-section\n"
    f"Hatch = zonal θ departure not sig. at {100*(1-ALPHA):.0f}% (N_boot={N_BOOT})",
    fontsize=13, y=1.02,
)
fig.tight_layout()
plt.show()
Loading θ (onset) ...
  Bootstrapping (N=1260, n_boot=1000) ...
  onset : mid 96% sig, avg 91% sig
Loading θ (peak) ...
  Bootstrapping (N=1260, n_boot=1000) ...
  peak  : mid 95% sig, avg 94% sig
Loading θ (decay) ...
  Bootstrapping (N=1260, n_boot=1000) ...
  decay : mid 94% sig, avg 91% sig
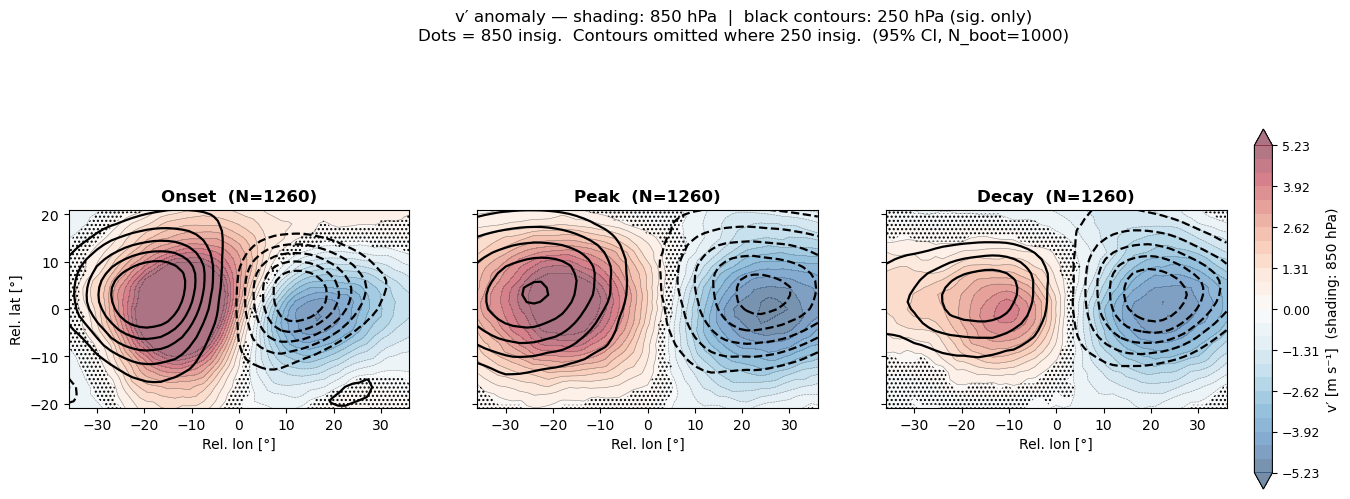
2b v′ baroclinic tilt — 250 hPa contours over 850 hPa shading
Upper-level (250 hPa, black contours) and lower-level (850 hPa, gray shading + white contours) meridional wind anomaly shown together to reveal the westward tilt with height characteristic of baroclinic blocking.
Shading: light gray = negative v′, dark gray = positive v′ (850 hPa)
Contours: solid = v′ > 0, dashed = v′ < 0
[4]:
# v' baroclinic tilt — now a single call to pvtend.plotting
plot_baroclinic_tilt(
    data_root=DATA_ROOT,
    stages=stages,          # ["onset", "peak", "decay"]
    dh=0,
    upper_hPa=250,
    lower_hPa=850,
    n_boot=N_BOOT,
    alpha=ALPHA,
    seed=SEED,
)
Level indices: 250 hPa → 6 (250), 850 hPa → 1 (850)
  onset: N=1260, bootstrapping ...
  peak: N=1260, bootstrapping ...
  decay: N=1260, bootstrapping ...
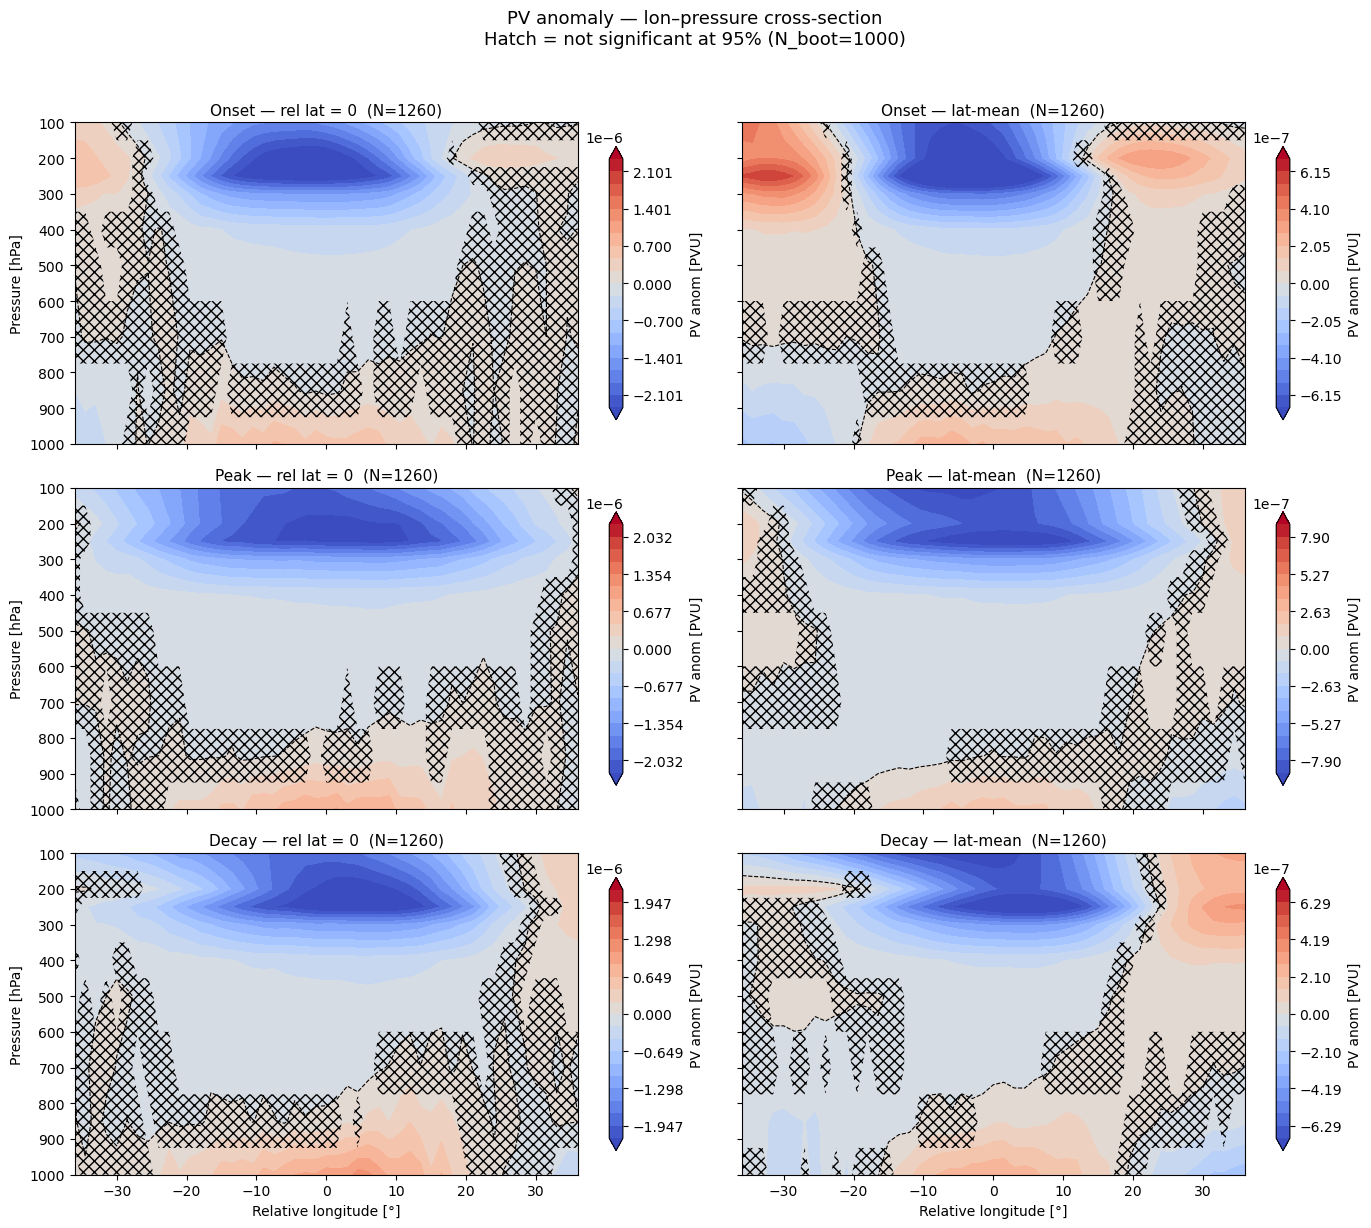
3 PV anomaly — lon–pressure cross-sections (onset / peak / decay)
[5]:
# Load per-event PV anomaly cross-sections & bootstrap
pv_xp = {}
for stg in stages:
    print(f"Loading PV anomaly ({stg}) ...")
    mid, avg = load_xsections(stg, "pv_anom_3d", dh=0)
    print(f"  Bootstrapping (N={mid.shape[0]}, n_boot={N_BOOT}) ...")
    mean_mid, sig_mid = bootstrap_xp(mid)
    mean_avg, sig_avg = bootstrap_xp(avg)
    pv_xp[stg] = dict(mean_mid=mean_mid, sig_mid=sig_mid,
                       mean_avg=mean_avg, sig_avg=sig_avg, n=mid.shape[0])
    print(f"  {stg:6s}: mid {100*sig_mid.mean():.0f}% sig, "
          f"avg {100*sig_avg.mean():.0f}% sig")

# Plot: 3 rows × 2 cols (lat=0 / lat-mean)
fig, axes = plt.subplots(3, 2, figsize=(14, 12), sharey=True, sharex=True)

for row, stg in enumerate(stages):
    d = pv_xp[stg]
    for col, (mean_fld, sig_mask, lbl) in enumerate([
        (d["mean_mid"], d["sig_mid"], "rel lat = 0"),
        (d["mean_avg"], d["sig_avg"], "lat-mean"),
    ]):
        ax = axes[row, col]
        vmax = np.nanpercentile(np.abs(mean_fld), 95)
        vmax = max(vmax, 1e-30)
        clev = np.linspace(-vmax, vmax, 21)

        cf = ax.contourf(x_vec, p_vec, mean_fld,
                         levels=clev, cmap="coolwarm", extend="both")
        ax.contour(x_vec, p_vec, mean_fld,
                   levels=[0], colors="k", linewidths=0.8, linestyles="--")
        # Insignificance hatching
        ax.contourf(x_vec, p_vec, (~sig_mask).astype(float),
                    levels=[0.5, 1.5], hatches=["xxx"], colors="none", zorder=5)

        ax.set_title(f"{stg.capitalize()} — {lbl}  (N={d['n']})", fontsize=11)
        if col == 0:
            ax.set_ylabel("Pressure [hPa]")
        if row == 2:
            ax.set_xlabel("Relative longitude [°]")
        plt.colorbar(cf, ax=ax, shrink=0.85, label="PV anom [PVU]")

axes[0, 0].invert_yaxis()
fig.suptitle(
    "PV anomaly — lon–pressure cross-section\n"
    f"Hatch = not significant at {100*(1-ALPHA):.0f}% (N_boot={N_BOOT})",
    fontsize=13, y=1.02,
)
fig.tight_layout()
plt.show()
Loading PV anomaly (onset) ...
  Bootstrapping (N=1260, n_boot=1000) ...
  onset : mid 62% sig, avg 75% sig
Loading PV anomaly (peak) ...
  Bootstrapping (N=1260, n_boot=1000) ...
  peak  : mid 75% sig, avg 78% sig
Loading PV anomaly (decay) ...
  Bootstrapping (N=1260, n_boot=1000) ...
  decay : mid 73% sig, avg 76% sig
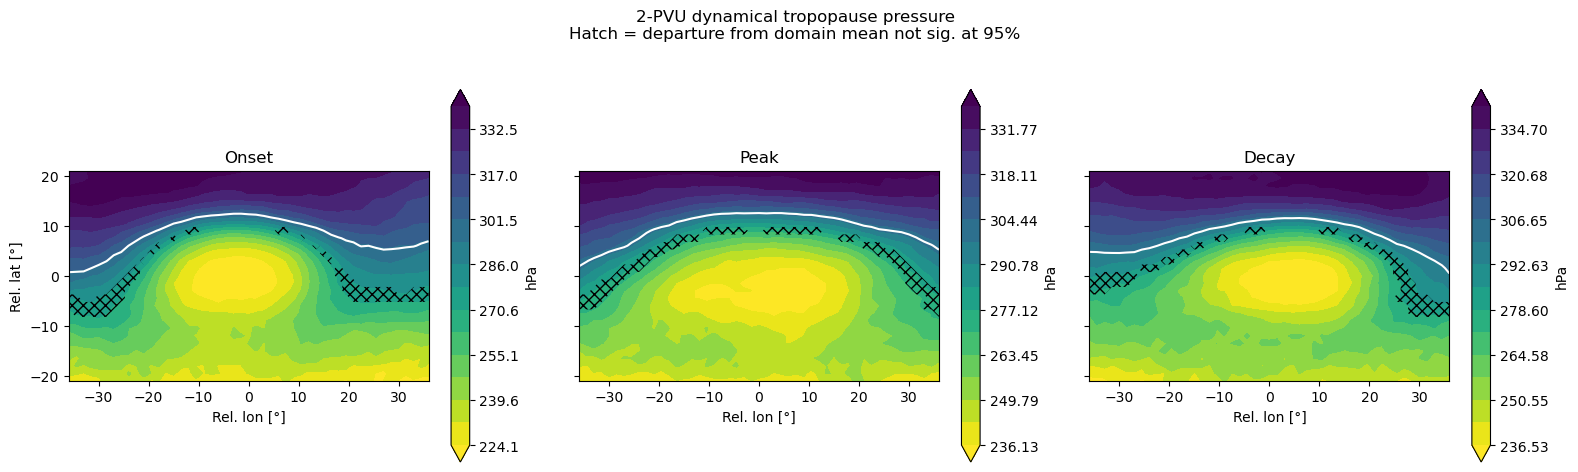
4 Dynamical tropopause pressure (2 PVU)
[6]:
def find_2pvu_pressure(pv_3d, levels_hPa):
    """Vectorised: find pressure where PV crosses 2.0 PVU at each grid point.

    Returns pressure in hPa (NaN where 2 PVU is not crossed).
    """
    target_pv = 2.0e-6  # 2 PVU in SI
    nlev = pv_3d.shape[0]
    p = levels_hPa.astype(float)

    trop_p = np.full(pv_3d.shape[1:], np.nan)
    # Search from surface (high p) upward (low p)
    for k in range(nlev - 1, 0, -1):
        below, above = pv_3d[k], pv_3d[k - 1]
        crossed = ((below <= target_pv) & (above >= target_pv)) | \
                  ((below >= target_pv) & (above <= target_pv))
        crossed &= np.isnan(trop_p)          # only first crossing
        frac = (target_pv - below) / (above - below + 1e-30)
        interp_p = p[k] + frac * (p[k - 1] - p[k])
        trop_p = np.where(crossed, interp_p, trop_p)
    return trop_p


def _load_trop(f):
    """Load pv_3d from one NPZ → 2-PVU tropopause pressure (nlat, nlon)."""
    try:
        d = np.load(f)
    except (BadZipFile, EOFError, OSError):
        return None
    return find_2pvu_pressure(d["pv_3d"], d["levels"].astype(float))


def load_trop_events(stage, dh=0):
    """Per-event 2-PVU tropopause pressure → (N, nlat, nlon)."""
    sign = "+" if dh >= 0 else ""
    npz_dir = f"{DATA_ROOT}/{stage}/dh={sign}{dh}"
    files = sorted(glob.glob(os.path.join(npz_dir, "track_*.npz")))
    with ThreadPoolExecutor(max_workers=8) as pool:
        results = list(pool.map(_load_trop, files))
    results = [r for r in results if r is not None]
    return np.array(results)                  # (N, nlat, nlon)


def bootstrap_2d(stack, n_boot=N_BOOT, alpha=ALPHA, seed=SEED):
    """Bootstrap mean + sig for (N, nlat, nlon). Ignores NaN in significance."""
    N = stack.shape[0]
    rng = np.random.default_rng(seed)
    boot = np.empty((n_boot, *stack.shape[1:]))
    for b in range(n_boot):
        idx = rng.integers(0, N, size=N)
        boot[b] = np.nanmean(stack[idx], axis=0)
    lo = np.nanpercentile(boot, 100 * alpha / 2, axis=0)
    hi = np.nanpercentile(boot, 100 * (1 - alpha / 2), axis=0)
    mean = np.nanmean(stack, axis=0)
    # For tropopause, test departure from domain-mean tropopause
    dmean = np.nanmean(mean)
    anom_lo = lo - dmean
    anom_hi = hi - dmean
    sig = ~((anom_lo <= 0) & (anom_hi >= 0))
    return mean, sig


# ── Load per-event tropopause & bootstrap ────────────────────────────────────
trop_press = {}
trop_sig   = {}
for stg in stages:
    print(f"Loading tropopause ({stg}) ...")
    stack = load_trop_events(stg, dh=0)
    print(f"  Bootstrapping (N={stack.shape[0]}, n_boot={N_BOOT}) ...")
    mean_tp, sig_tp = bootstrap_2d(stack)
    trop_press[stg] = mean_tp
    trop_sig[stg]   = sig_tp
    tp = mean_tp
    print(f"  {stg:6s}: trop-p range = {np.nanmin(tp):.0f} – {np.nanmax(tp):.0f} hPa, "
          f"NaN frac = {np.isnan(tp).mean():.2%}, {100*sig_tp.mean():.0f}% sig")
Loading tropopause (onset) ...
  Bootstrapping (N=1260, n_boot=1000) ...
  onset : trop-p range = 216 – 345 hPa, NaN frac = 0.00%, 96% sig
Loading tropopause (peak) ...
  Bootstrapping (N=1260, n_boot=1000) ...
  peak  : trop-p range = 230 – 344 hPa, NaN frac = 0.00%, 95% sig
Loading tropopause (decay) ...
  Bootstrapping (N=1260, n_boot=1000) ...
  decay : trop-p range = 228 – 348 hPa, NaN frac = 0.00%, 95% sig
[7]:
fig, axes = plt.subplots(1, 3, figsize=(16, 4.5), sharey=True)

for ax, stg in zip(axes, stages):
    tp = trop_press[stg]
    sig = trop_sig[stg]
    vmin, vmax_p = np.nanpercentile(tp, [5, 95])
    cf = ax.contourf(X_rel[0], Y_rel[:, 0], tp,
                     levels=np.linspace(vmin, vmax_p, 16), cmap="viridis_r", extend="both")
    ax.contour(X_rel[0], Y_rel[:, 0], tp,
              levels=[300], colors="white", linewidths=1.5)
    # Insignificance hatching
    ax.contourf(X_rel[0], Y_rel[:, 0], (~sig).astype(float),
                levels=[0.5, 1.5], hatches=["xxx"], colors="none", zorder=5)
    ax.set_title(f"{stg.capitalize()}")
    ax.set_aspect("equal")
    ax.set_xlabel("Rel. lon [°]")
    plt.colorbar(cf, ax=ax, label="hPa")

axes[0].set_ylabel("Rel. lat [°]")
fig.suptitle(
    "2-PVU dynamical tropopause pressure\n"
    f"Hatch = departure from domain mean not sig. at {100*(1-ALPHA):.0f}%",
    y=1.04,
)
fig.tight_layout()
plt.show()
Summary
The blocking PV anomaly is strongest in the upper troposphere (200–300 hPa) with a negative PV anomaly that deepens through the lifecycle.
The longitude–pressure cross-section reveals the tilted, baroclinic structure of the blocking high, with the PV anomaly extending from 500 hPa to 100 hPa.
The 2-PVU tropopause is lifted (lower pressure) over the blocking centre, indicating the locally elevated tropopause associated with blocking.